SP500 briefly recovers from slump, CPI stable
CPI results on Wednesday show that the US economy is ‘sluggish and stable’, exactly where the FED would like to be while inflation is tamed. AT 0.2% for the month, this brings the yearly CPI position to 3.2%. This figure is still above the FED’s acceptable range of CPI / inflation so we’d anticipate rate cuts are still a little while away. If the FED implements rate cuts too quickly, the economy could be at risk of growing too quickly again (ie – retail prices continue to increase). From an economic perspective, the FED would prefer to delay rate cuts for as long as possible, even at the cost of mortgage holders across the country.
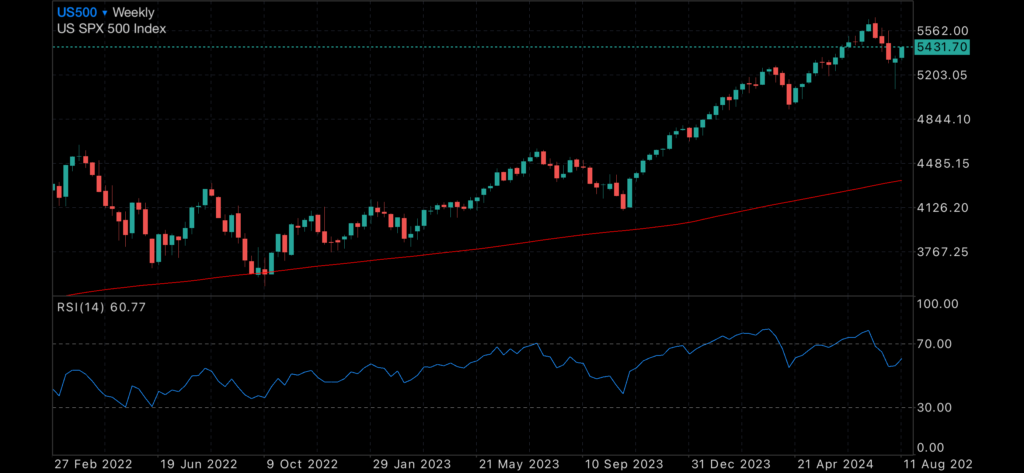
If you look at our daily charts, especially for the SP500 you might see that the ‘recovery’ that everyone is excited about looks a little weaker than they are telling us. We may well look back on this chart as an inflection point for the market in general. Through our eyes, it still has massive potential to become a ‘Dead Cat Bounce’.
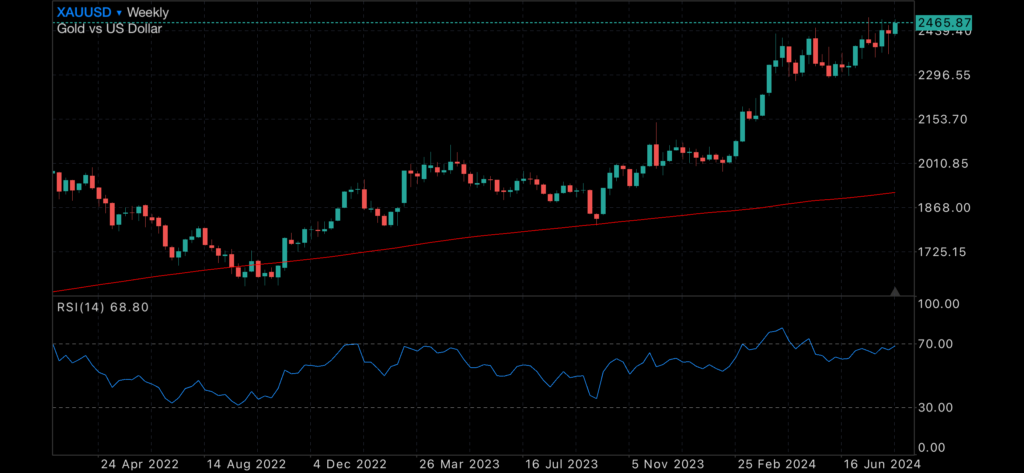
Gold has moved higher this week, on the back of last week’s poor sharemarket response. At time of writing just now, we’re moments away from a new all time high for the precious metal.
Enjoy today’s forecasts.
Gold daily chart, with 200MDA

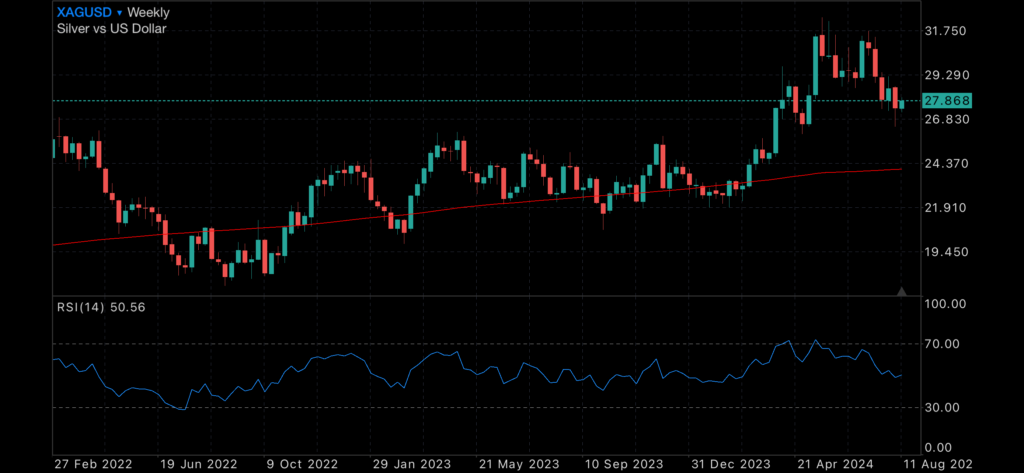
Silver daily chart, with 200MDA

US500, with 200MDA

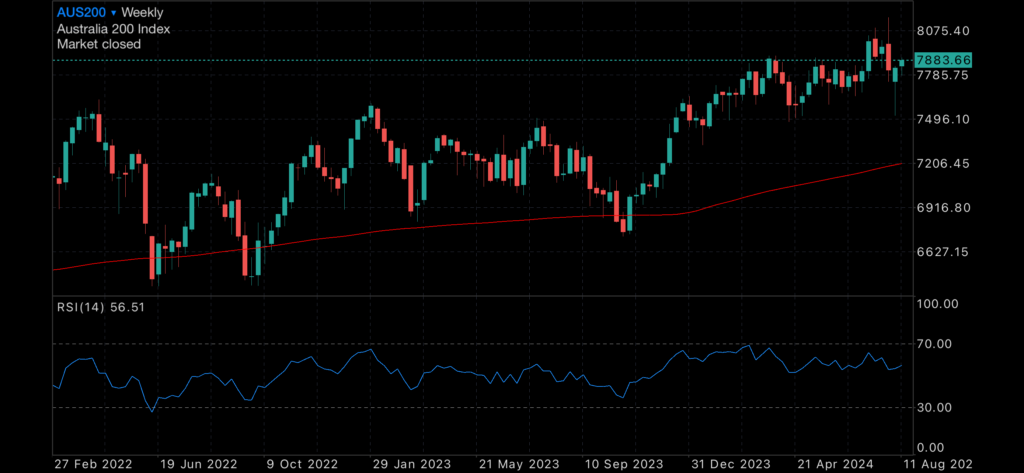
ASX200, with 200MDA

Gold Futures Technical Analysis
Gold Futures monthly analysis continues to recommend a STRONG BUY with Weekly analysis a BUY signal.
Technical indicators – Monthly Projections
| RSI(14) | Overbought |
| STOCH(9,6) | Buy |
| STOCHRSI(14) | Overbought |
| MACD(12,26) | Buy |
| ADX(14) | Buy |
| Williams %R | Overbought |
| CCI(14) | Buy |
| ATR(14) | Less Volatility |
| Highs/Lows(14) | Buy |
| Ultimate Oscillator | Buy |
| ROC | Buy |
| Bull/Bear Power(13) | Buy |
Summary for Monthly forecast: Strong Buy
*Not financial advice, please DYOR prior to any investment decisions you make.