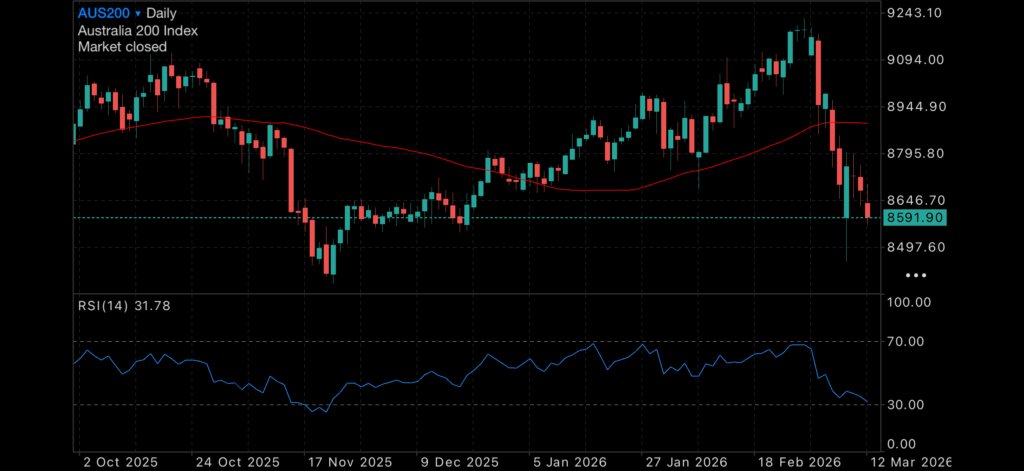
Next two weeks critical for Economy

Gold Pricing $7179
Silver Pricing: $118.65
Platinum Pricing: $3019.93
Oil markets continue to swing wildly as the Iran conflict deepens, with reports that two oil tankers have now sunk in the region, further disrupting already fragile supply routes. Brent crude has been bouncing higher as countries dependent on imported oil scramble to reassess their contingency plans. The International Energy Agency has agreed to release strategic petroleum reserves to stabilise supply, but moving that oil across the world is another matter entirely. For nations like Australia and New Zealand, which sit at the far end of global shipping routes, getting access to those reserves could take weeks rather than days.
New Zealand is already discussing emergency demand measures, including a proposed “drive-free” day once a week to reduce fuel consumption and stretch existing reserves. It is a reminder of just how quickly oil shocks can ripple through economies that rely heavily on imported fuel.
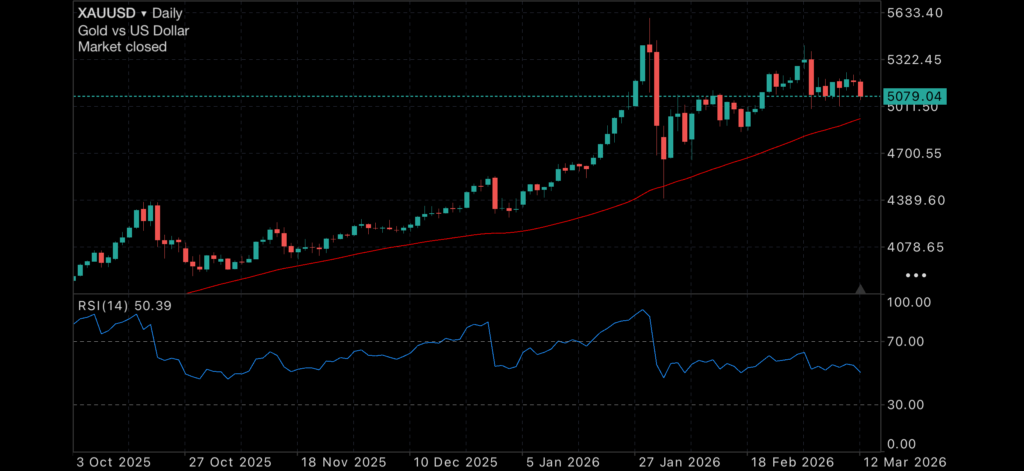
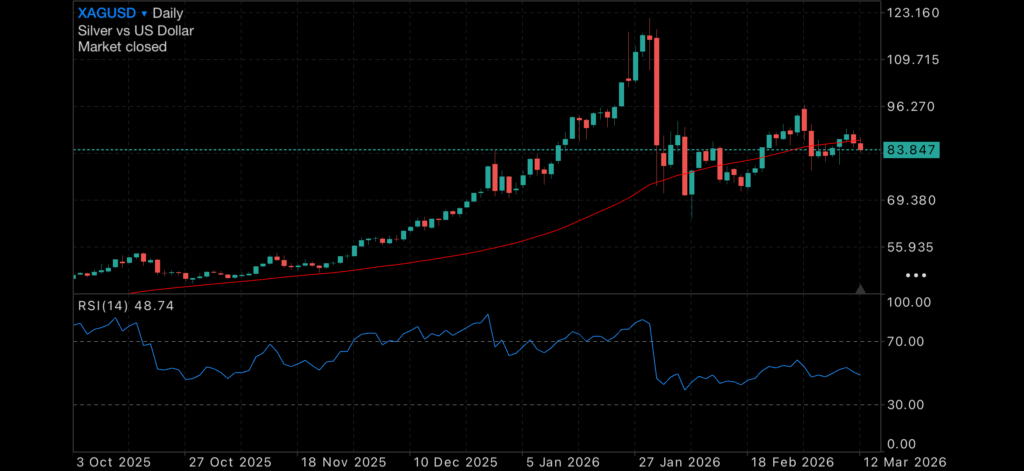
Gold pulled back slightly overnight after recent strength, but the broader trend remains intact. The metal continues to sit comfortably above its 50-day moving average, suggesting underlying demand remains firm despite short-term volatility. Silver followed a similar pattern, easing a touch but holding within a relatively strong trading range.
The next two weeks may prove critical. If the Iran conflict expands and energy disruptions worsen, the global economy could face a difficult fork in the road. Persistent supply shocks would raise the risk of stagflation, where high inflation and weak growth arrive together. If energy markets stabilise quickly, the damage may instead resemble a more traditional recession driven by slowing demand and tightening financial conditions. Either way, the coming fortnight is likely to set the tone for markets heading into the second half of the year.
Gold Futures Technical Analysis
Technical indicators for Gold Futures suggest a STRONG BUY on both monthly and weekly analyses.
Technical Indicators – Monthly Projections
| RSI(14) | Overbought |
| STOCH(9,6) | Buy |
| STOCHRSI(14) | Buy |
| MACD(12,26) | Buy |
| ADX(14) | Overbought |
| Williams %R | Overbought |
| CCI(14) | Buy |
| ATR(14) | High Volatility |
| Highs/Lows(14) | Buy |
| Ultimate Oscillator | Buy |
| ROC | Buy |
| Bull/Bear Power(13) | Buy |
Enjoy today’s charts.
Gold daily chart, with 50MDA
Silver daily chart, with 50MDA
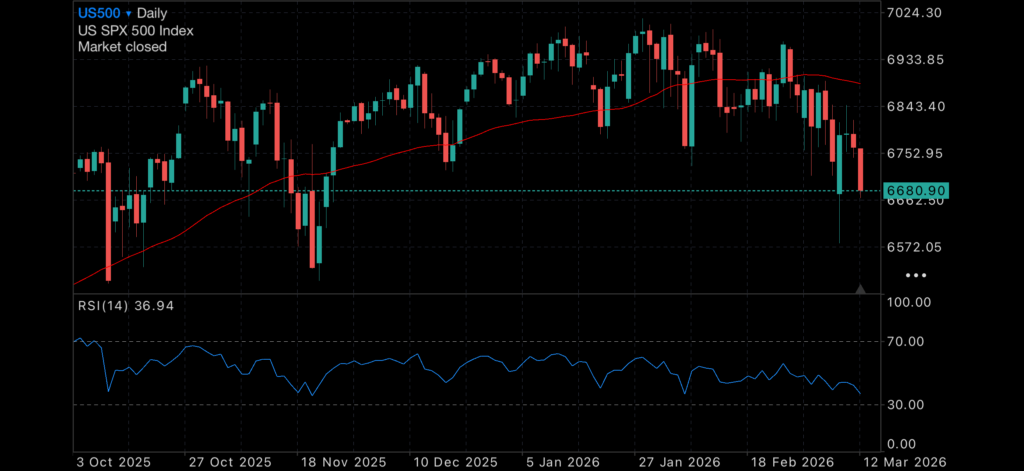
US500, with 50MDA
ASX200, with 50MDA