

Markets Shrug Off Geopolitical Risk as Volatility Returns
Gold Pricing $5808.15
Silver Pricing: $82.84
Platinum Pricing: $2302.82
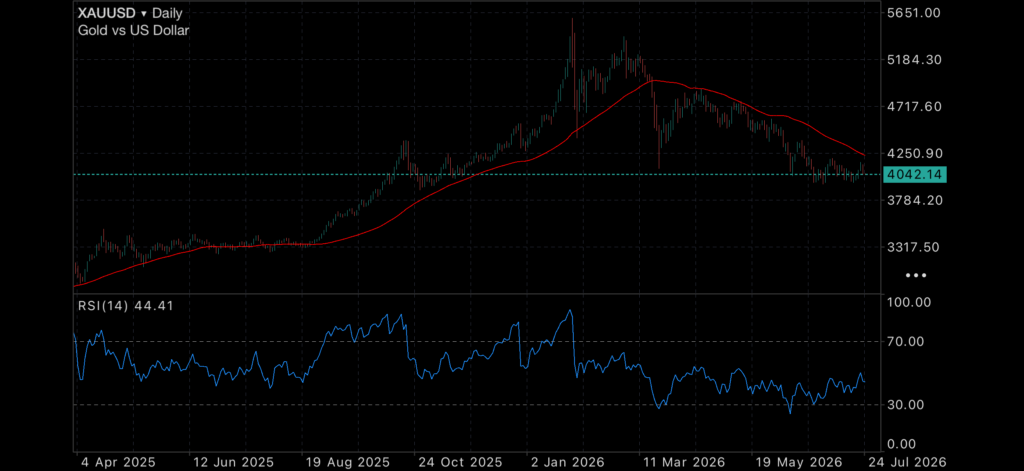
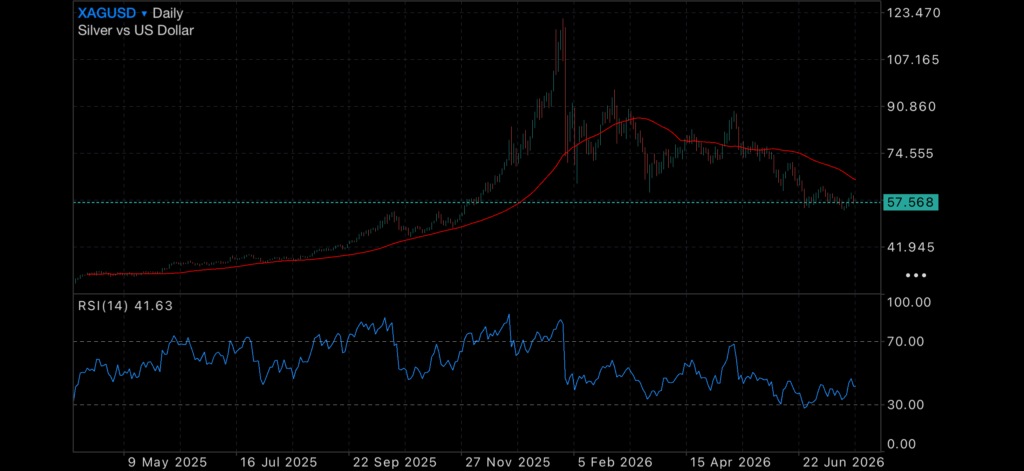
Despite a sharp escalation in tensions between the United States and Iran, traditional safe-haven assets are refusing to behave as many investors would expect. The VIX, Wall Street’s widely watched “fear gauge”, jumped around 12% overnight as markets priced in a higher level of uncertainty, yet gold and silver remained largely unchanged, continuing to trade sideways despite the worsening geopolitical backdrop.
The disconnect is becoming one of the more interesting themes for investors. Historically, major geopolitical events have often driven capital into precious metals, particularly when conflict threatens global energy supplies. While oil prices have responded to the renewed tensions, gold and silver have so far remained remarkably stable. It suggests that investors may still believe any disruption will be contained, or that elevated interest rates and confidence in broader financial markets continue to limit demand for traditional safe havens.
Adding to the cautious outlook, the latest US Leading Economic Index fell 0.2%, missing expectations and reinforcing signs that economic momentum is slowing. Consumer spending is beginning to soften, although business investment—particularly around artificial intelligence infrastructure—continues to provide an important source of economic support. At the same time, inflation continues its gradual improvement, leaving markets caught between slowing growth and hopes that the economy can avoid a more significant downturn.
For now, precious metals appear to be quietly absorbing the geopolitical uncertainty rather than reacting to it. With volatility increasing and economic indicators weakening, investors will be watching closely to see whether gold and silver eventually resume their traditional role as defensive assets, or whether this cycle continues to defy historical expectations.
Enjoy today’s charts
Gold daily chart, with 50MDA
Silver daily chart, with 50MDA
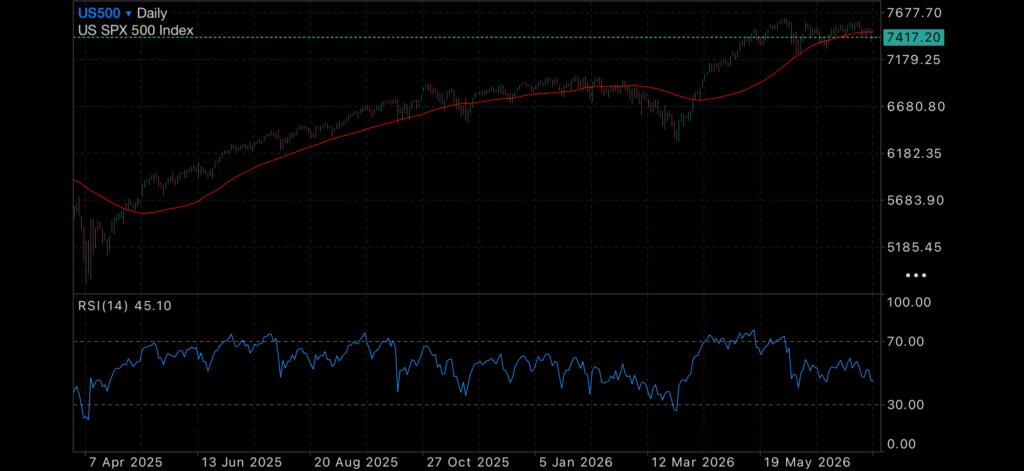
US500, with 50MDA
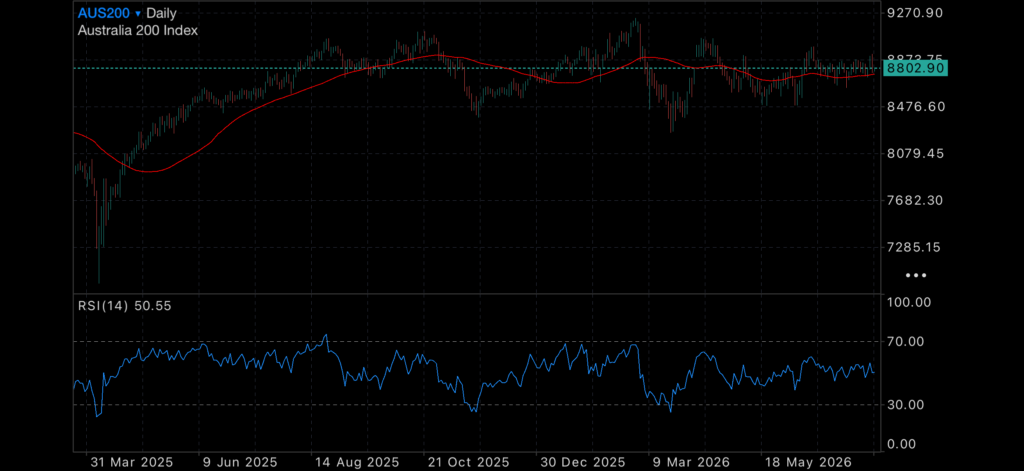
ASX200, with 50MDA
Gold Futures Technical Analysis
Technical indicators for Gold Futures suggest NEUTRAL on monthly analysis.
Technical Indicators – Monthly Projections
| RSI(14) | Buy |
| STOCH(9,6) | Sell |
| STOCHRSI(14) | Oversold |
| MACD(12,26) | Buy |
| ADX(14) | Buy |
| Williams %R | Sell |
| CCI(14) | Neutral |
| ATR(14) | High Volatility |
| Highs/Lows(14) | Neutral |
| Ultimate Oscillator | Sell |
| ROC | Buy |
| Bull/Bear Power(13) | Sell |


