Markets Celebrate Softer Inflation as Geopolitical Risks Continue to Build
Gold Spot Price AUD $5808.53
Silver Spot Price AUD $84.24
Platinum Spot Price AUD $2343.86
Financial markets welcomed a surprisingly soft US inflation result overnight, with CPI coming in below expectations and reinforcing the view that inflation is continuing to ease despite ongoing government spending and elevated geopolitical tensions. The data has strengthened expectations that the Federal Reserve will have more flexibility to reduce interest rates later this year, helping fuel another broad-based rally across global markets.
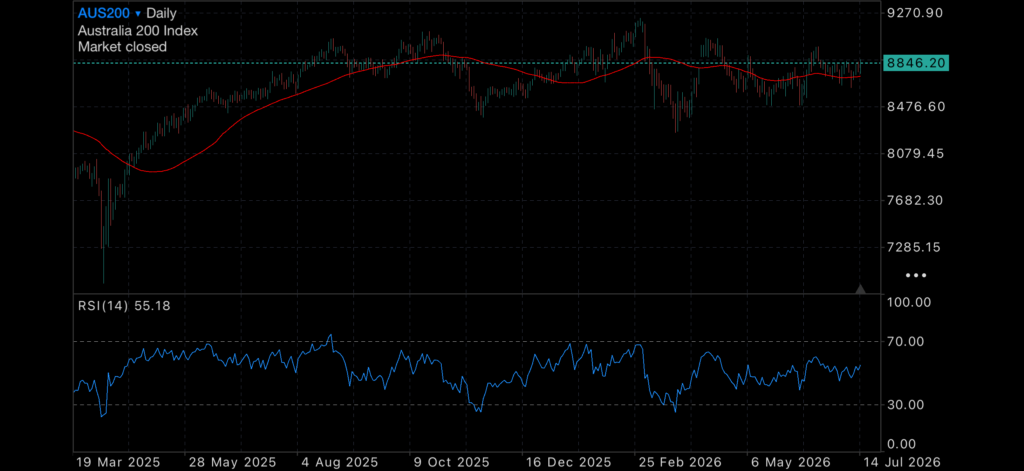
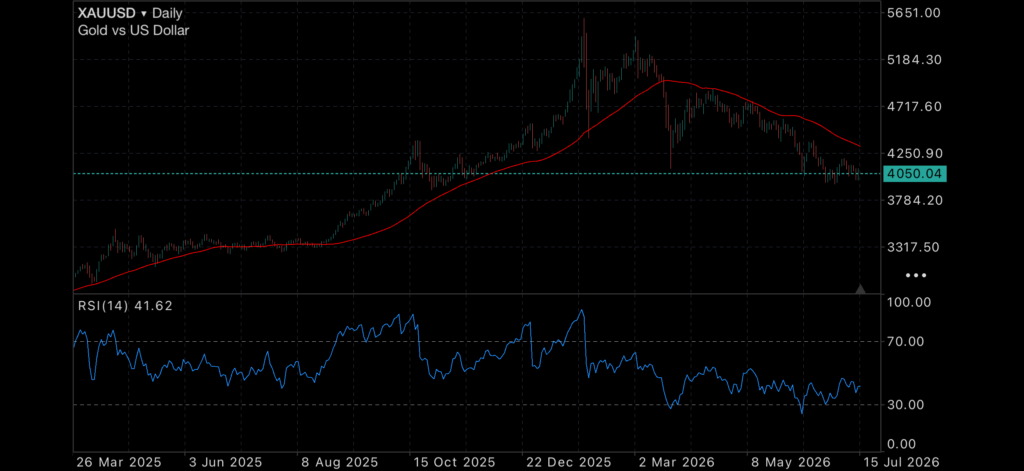
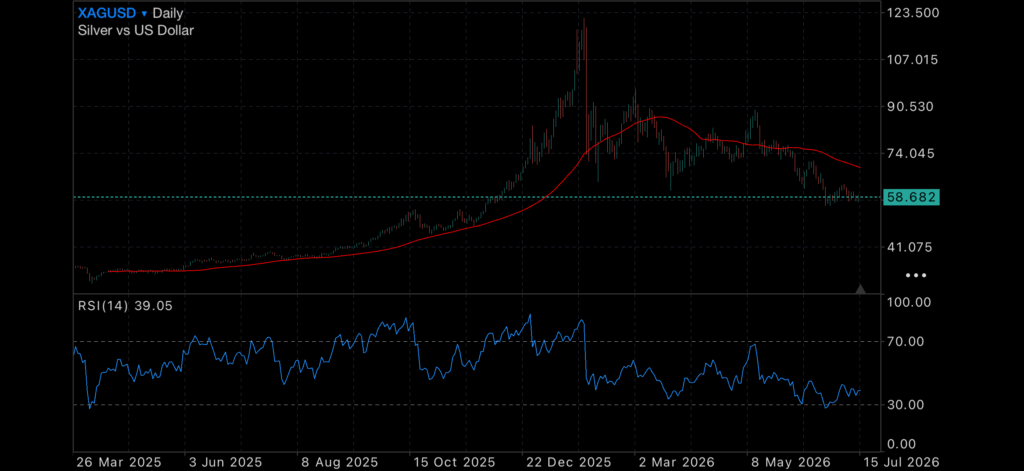
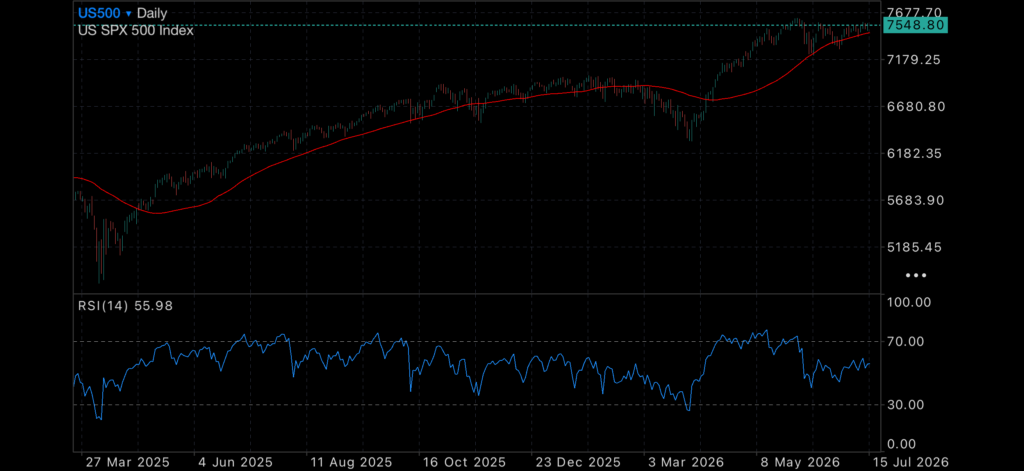
Risk appetite was on full display. The S&P 500 pushed higher, the ASX followed suit, the VIX eased further, and oil prices continued to climb. Gold and silver initially responded positively to the inflation data, but both metals surrendered much of their gains as investors rotated back into equities. The move highlights the current market narrative, where softer inflation is outweighing concerns around global instability.
Yet beneath the optimism, the geopolitical backdrop continues to deteriorate. Saudi Arabia’s reported military action around Yemen has effectively opened another front in the wider Iran-US conflict, adding another layer of uncertainty to an already fragile Middle East. Ordinarily, such developments would be expected to drive stronger demand for traditional safe-haven assets such as gold. Instead, investors appear increasingly comfortable assuming the conflict will remain regionally contained and have continued to favour risk assets.
Whether that confidence proves justified remains to be seen. Markets are once again pricing in a relatively smooth economic outlook, but with multiple flashpoints across the Middle East and energy markets remaining vulnerable, geopolitical risk has certainly not disappeared – it has simply been pushed into the background while investors focus on improving inflation and the prospect of lower interest rates.
Enjoy today’s charts
Gold daily chart, with 50MDA
Silver daily chart, with 50MDA
US500, with 50MDA
ASX200, with 50MDA