Gold Breaks Higher as US Productivity Surprises
Gold Spot Price $6060.94
Silver Spot Price $88.64
Platinum Spot Price $2480.46
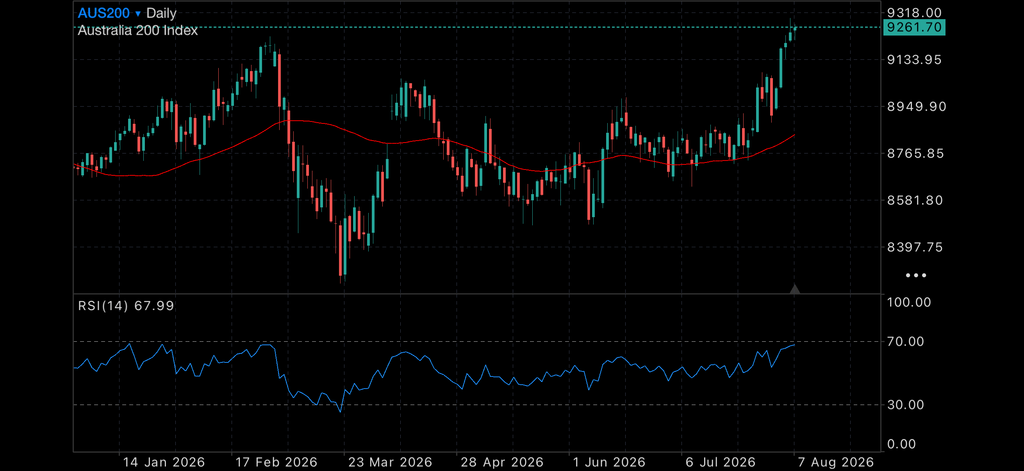
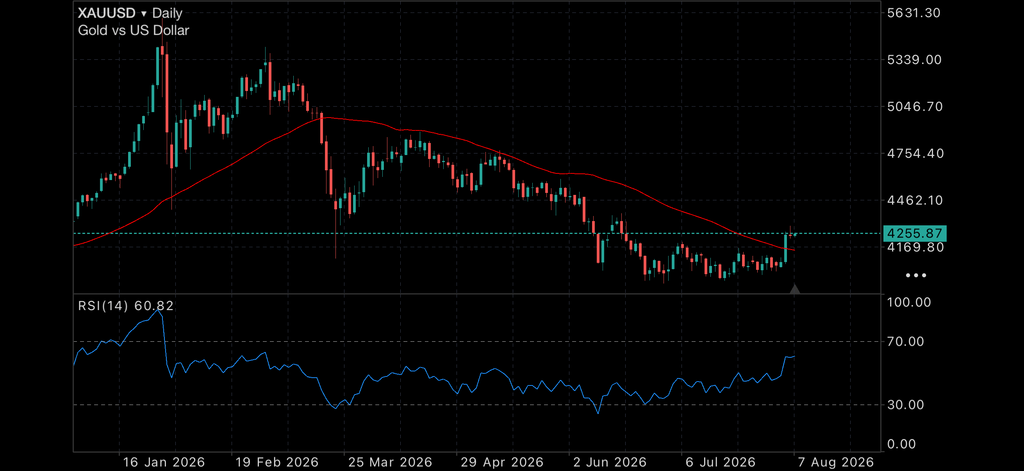
Gold has surged through its 50-day moving average, delivering one of its strongest technical signals in months. The move follows growing optimism that a potential agreement in the Middle East could reduce pressure on global energy prices and, in turn, soften the inflation outlook.
Cheaper oil would normally reduce demand for defensive assets, particularly if geopolitical tensions are also easing. However, the prospect of lower energy-driven inflation may give central banks greater flexibility on interest rates. Lower rates and falling bond yields generally improve gold’s appeal, helping explain why bullion has rallied even as some of the immediate geopolitical risk begins to fade.
The break above the 50-day moving average is important after months of compressed and largely sideways trading. Gold will now need to hold above this level to confirm that the move is more than another brief rally, but momentum has clearly shifted in favour of buyers.
Meanwhile, US nonfarm business productivity increased at an annualised rate of 1.4% during the June quarter, comfortably ahead of forecasts for 0.6%. Output increased by 1.7% while hours worked rose by only 0.3%, suggesting American businesses are producing more without requiring a comparable increase in labour.
AI investment will inevitably receive some of the credit. Businesses have poured enormous amounts of capital into automation, software and data infrastructure, and the latest figures may be an early sign that these investments are beginning to lift economic output. However, the evidence remains mixed. Some workplace studies have found that time saved using AI is often lost correcting inaccurate work, managing additional output or reviewing low-quality material.
For now, the productivity numbers are encouraging, but one quarter does not prove that AI has transformed the economy. Gold’s breakout is similarly promising, although holding above the 50-day moving average will be the real test of whether the market has finally entered a more bullish phase.
Enjoy today’s charts
Gold daily chart, with 50MDA
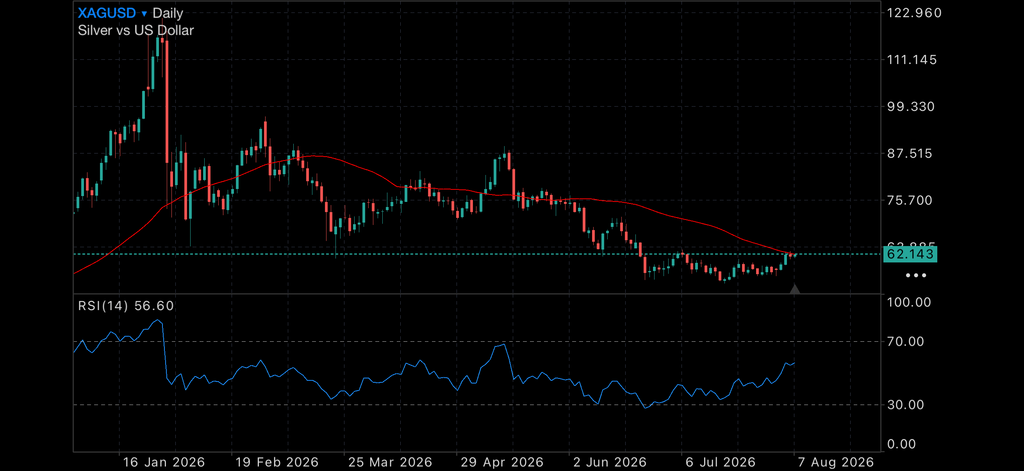
Silver daily chart, with 50MDA
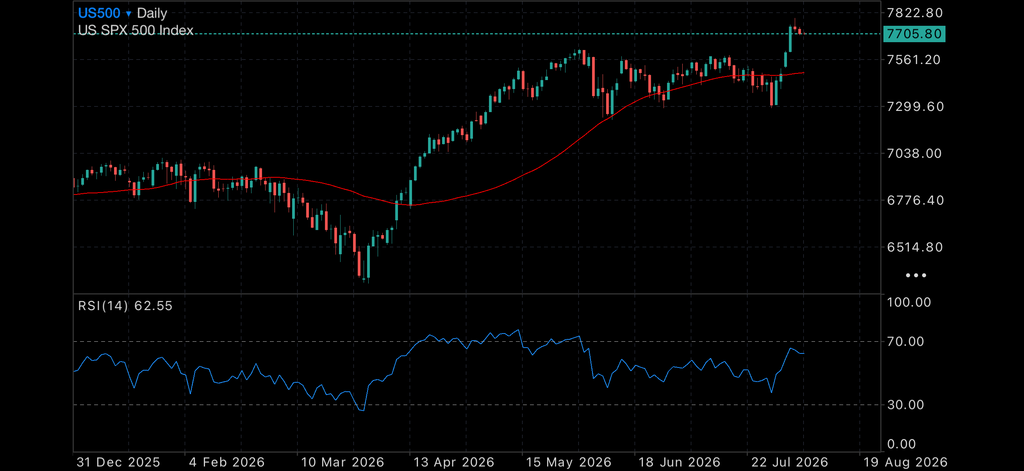
US500, with 50MDA
ASX200, with 50MDA