ASX200 highs and lows
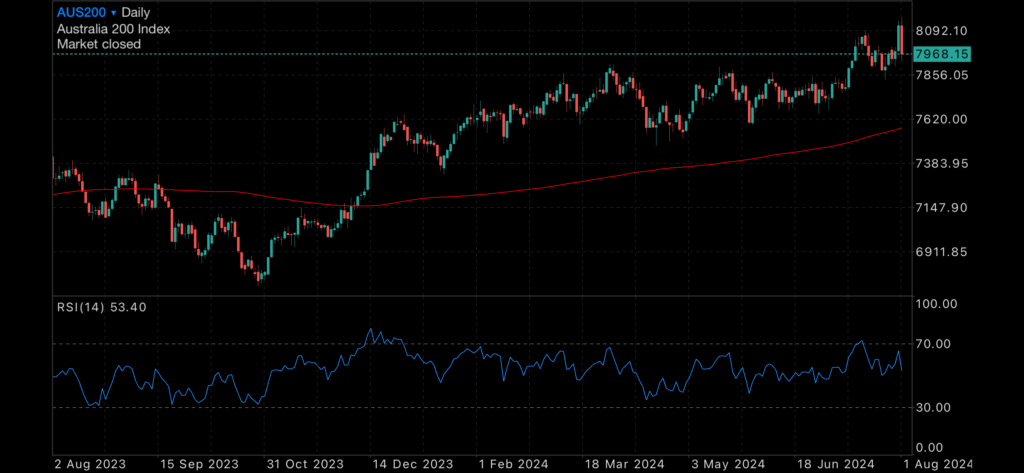
The ASX200 hit an all time high yesterday, causing much celebration amongst Australian investors and commentators; albeit the celebration was short lived. The market closed late yesterday below its psychological ceiling of 8000 (currently sitting at 7968). With many saying this is a healthy pull back, to see such a quick and responsive drop is concerning. Australia is uniquely positioned to weather both our RBA interest rate decision while also being directly affected by US political news. The next few months, Investor Beware. If you’re afraid of volatility it may be best to sit the next play out.
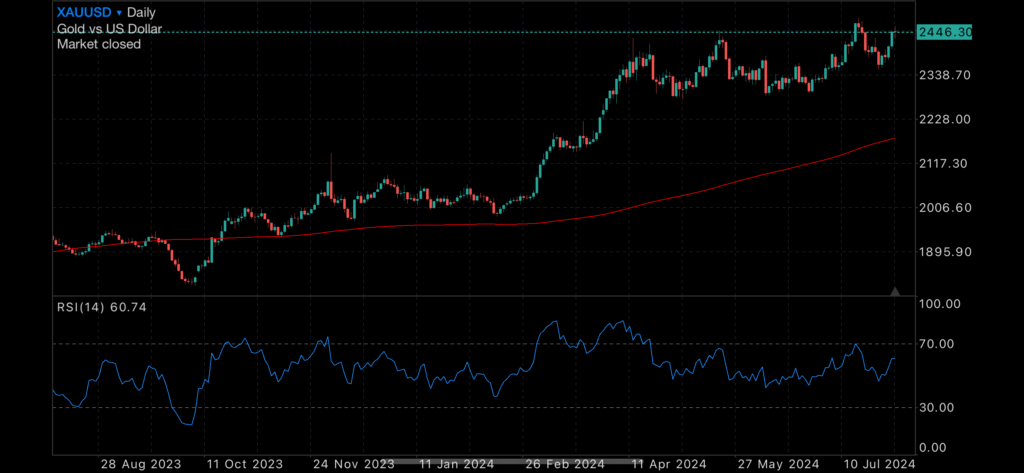
Gold looks to be recovering and following its previously bullish pattern. We’re looking closely to see if it breaches its upper price ceiling of $US2482. Once this is achieved we’d be looking forwards to continued new highs.
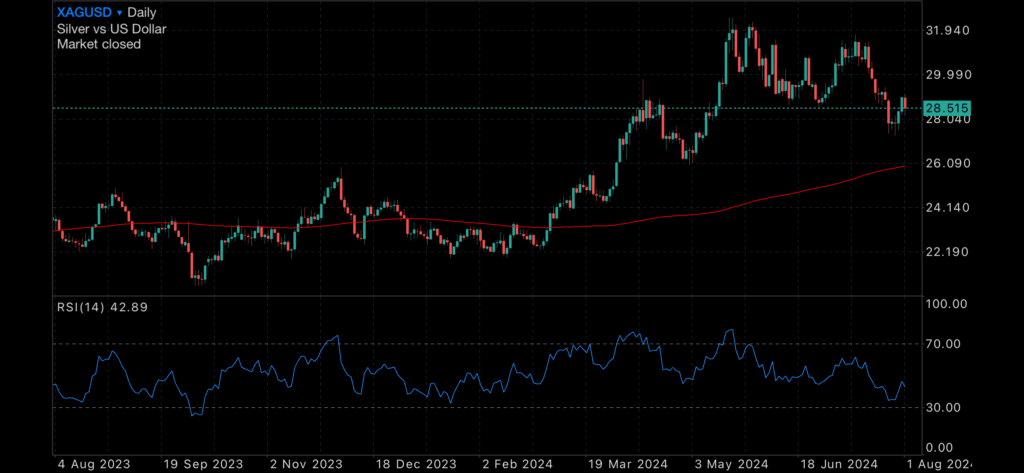
Silver is still lagging well behind in pricing, causing concern for metals investors. As Silver plays a unique role in both precious metals and industrial application, generally it benefits from higher Gold pricing and also higher industrial demand in cars, computers and solar application. With Silver ticking all the boxes, pricing simply isn’t matching demand and the GSR (Gold to Silver Ratio) is still quite high. In 2011 (The end days of the GFC) the GSR hit 31 – currently the GSR is 85. Perhaps the GSR could well be warning us that economically we have further to go in our recovery. Regardless, Silver bugs are still waiting for their well deserved jump in pricing.
In more international conflict news, Hamas leader Ismail Haniyeh was assassinated in his Iran home and Hezbollah commander Fuad Shukr was killed during an air strike in Lebanon. No one has taken responsibility for the deaths, but tension in the region has escalated once again.
Enjoy today’s charts and forecast below
Gold daily chart, with 200MDA

Silver daily chart, with 200MDA

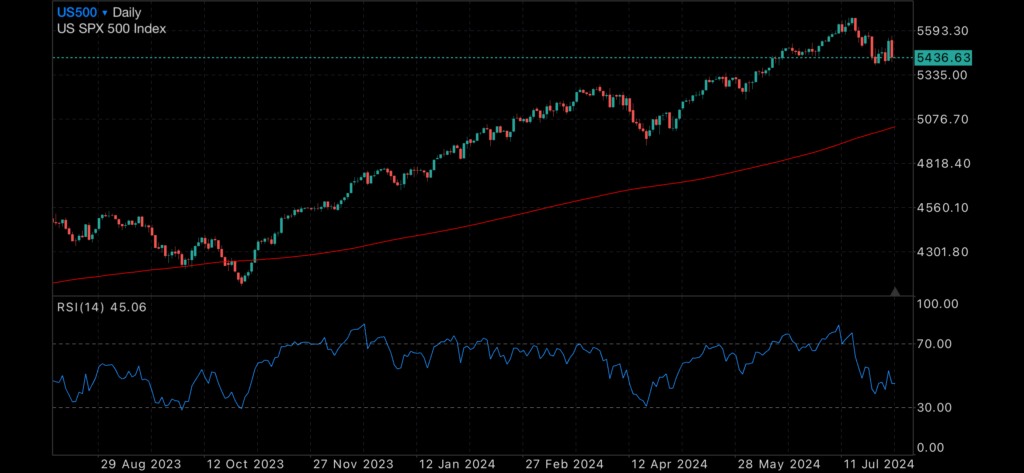
US500, with 200MDA

ASX200, with 200MDA

Gold Futures Technical Analysis
Gold Futures monthly analysis continues to recommend a STRONG BUY with Weekly analysis a STRONG BUY signal.
Technical indicators – Monthly Projections
| RSI(14) | Overbought |
| STOCH(9,6) | Buy |
| STOCHRSI(14) | Overbought |
| MACD(12,26) | Buy |
| ADX(14) | Buy |
| Williams %R | Overbought |
| CCI(14) | Buy |
| ATR(14) | Less Volatility |
| Highs/Lows(14) | Buy |
| Ultimate Oscillator | Buy |
| ROC | Buy |
| Bull/Bear Power(13) | Buy |
Summary for Monthly forecast: Strong Buy
*Not financial advice, please DYOR prior to any investment decisions you make.