

AI Euphoria Meets Reality as Leverage Unwinds
Gold Spot Price $5812.56
Silver Spot Price: $83.60
Platinum Spot Price $2333.84
Global markets have endured a turbulent few days as one of the year’s biggest AI-driven success stories rapidly turned into a lesson on the dangers of leverage. South Korea’s sharemarket suffered extraordinary volatility, with circuit breakers and trading curbs repeatedly activated as heavily leveraged positions in semiconductor giants Samsung and SK Hynix were unwound. Regulators have now tightened restrictions on leveraged investment products in an attempt to restore stability after trillions of dollars in market value were erased during the sell-off.
The sharp reversal is a timely reminder that markets can often fall much faster than they rise. While the long-term outlook for artificial intelligence remains positive, much of the recent rally had become increasingly dependent on borrowed money and investor optimism. When sentiment shifted, forced liquidations amplified the decline, creating a self-feeding cycle of selling that spread well beyond South Korea’s technology sector. Although markets have shown signs of stabilising, investors will be watching closely to see whether this proves to be a healthy correction or the first crack in the broader AI-driven bull market.
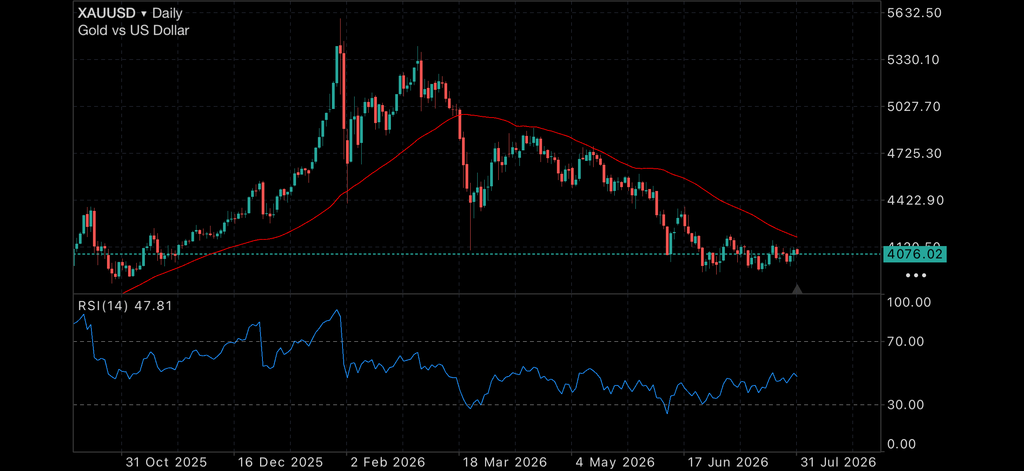
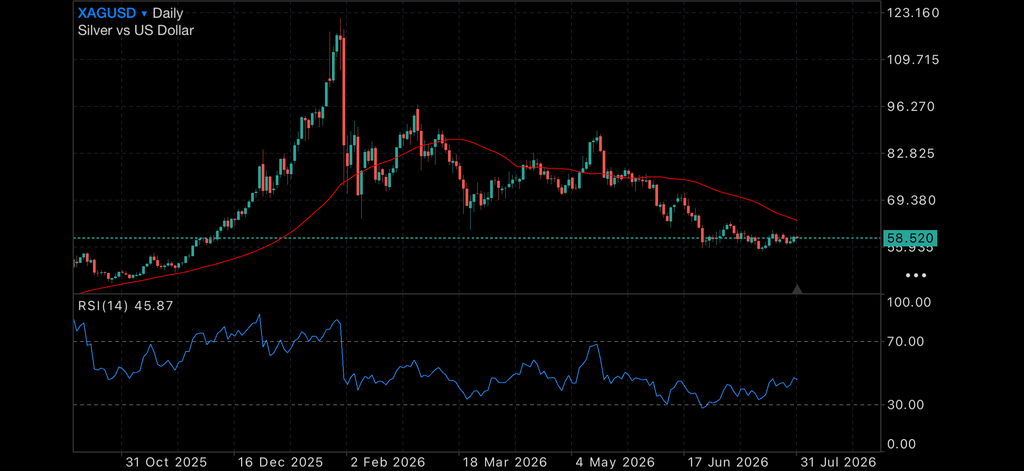
Meanwhile, precious metals continue to sit in a holding pattern. Gold and silver have spent recent sessions trading sideways despite heightened market volatility. Under normal circumstances, sharp equity declines would often encourage investors towards traditional safe-haven assets. Instead, bullion markets appear content to wait for clearer signals on interest rates, inflation and global economic growth before committing to their next major move.
For now, financial markets remain caught between two competing narratives. Artificial intelligence continues to promise enormous productivity gains and corporate earnings growth, while rising leverage, elevated valuations and slowing economic momentum remind investors that even the strongest bull markets are never immune from periods of sharp correction.
Enjoy today’s charts
Gold daily chart, with 50MDA
Silver daily chart, with 50MDA
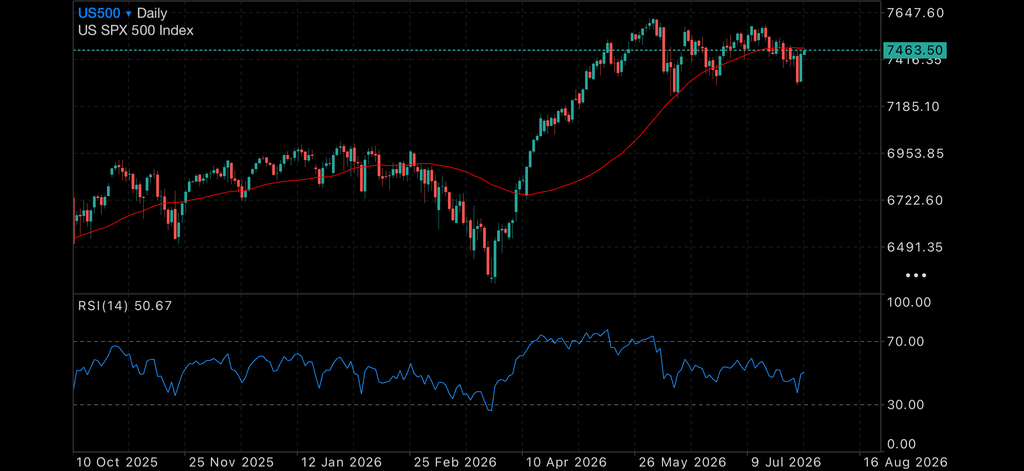
US500, with 50MDA
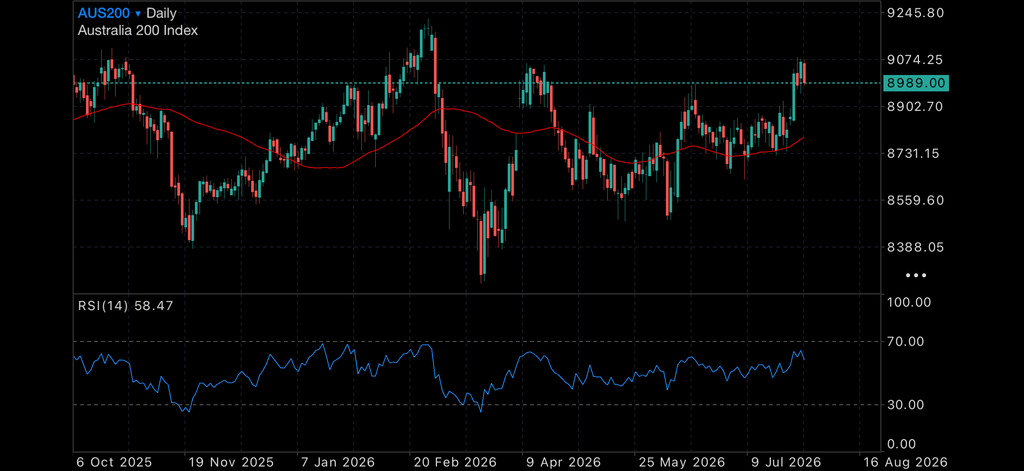
ASX200, with 50MDA
Gold Futures Technical Analysis
Technical indicators for Gold Futures suggest NEUTRAL on monthly analysis.
Technical Indicators – Monthly Projections
| RSI(14) | Buy |
| STOCH(9,6) | Sell |
| STOCHRSI(14) | Oversold |
| MACD(12,26) | Buy |
| ADX(14) | Buy |
| Williams %R | Sell |
| CCI(14) | Neutral |
| ATR(14) | High Volatility |
| Highs/Lows(14) | Neutral |
| Ultimate Oscillator | Sell |
| ROC | Buy |
| Bull/Bear Power(13) | Sell |


